
Apologies to all non-DKE readers; this one’s pretty fratty.
In light of my friend Nog putting the finishing touches on his own personal Pong table – and me playing on said table this past weekend – I’ve been thinking a lot about pong. That train of thought lead me, once again, back to the Brother Pi Pong Tournament, and the data we collected to keep record of that competition. Feel free to go and check out my Original Analysis of that data.
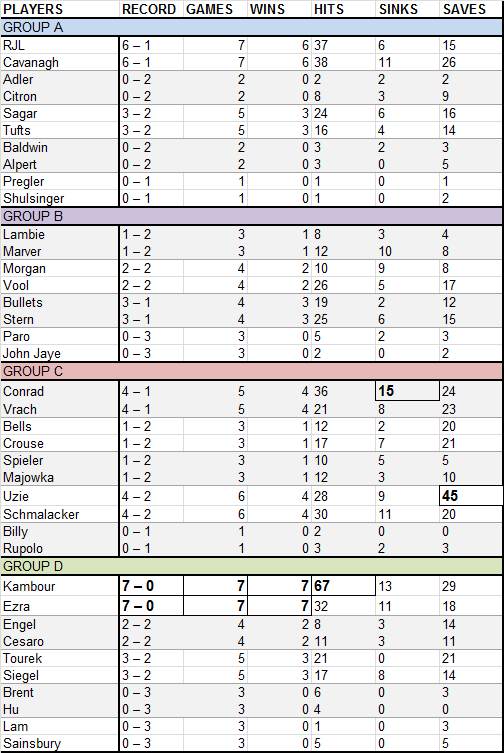
Unfortunately, there’s no new data, and the original set is quite limited, but in playing around with the numbers some more I’ve come up with a few new thoughts and ideas I want to lay out here. I also thought it would be helpful to lay out the raw data I’m pulling from for ease of reference:
Glad we got that out of the way. Now to the fun stuff.
Game-Wide Statistics
The main downfall of our current Saves analysis is that we don’t have any data on how many Save Opportunities a defender faced. For instance, Uzi is above and beyond the leader in the club-house for Total Saves and Saves/Game, yet that is likely because he faced more Save Opportunities than anyone else. I do not point this out to say that Uzi is not an exceptional defender – it’s safe to guess he truly does excel in this area – but instead to state the obvious: that Save Rate (Saves/Save Opportunities) would be a much better statistical measurement of the quality of a player’s defensive abilities.
The ability to retroactively generate the data necessary to calculate personal Save Rates is unfortunately not possible. However, what I’ve only just realized is that we can still take a look at what the tournament’s Average Save Rate was by combining the number of Total Unsaved Hits with the number of Saves. This doesn’t tell us much about individual performances, but as a student of the game, I still find it quite interesting.
Instead of of taking a look at individual stats, or even team stats, as we’ve done before, let’s examine broader tournament stats.
 Interesting stuff already.
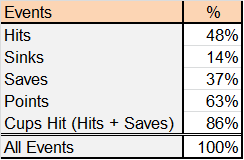
Let’s now examine Average Save Rate. In crunching numbers, we still can’t determine how much more adept Uzi (7.5/game) is at Saving than, say, RJL (2.1/game). What we can tell, though, is that on average 43.6% of all Cups Contacted are Saved. Conversely, if you make contact with (but don’t Sink on) a Cup, you have a 56.3% chance of scoring a Point.
In fact, here’s the percentage breakdown of all these various events:
What I thought would also be fun is to break down the major categories by Class year (win% was too complicated for this round, but maybe something I’ll look at in the future).
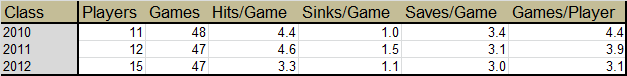
Nice work, 2011.
Another simple analysis, one that is perhaps the most fun, is to look at Beer as a stat.
Beers Consumed
To clarify for all readers: In the game of Pong, an unsaved Hit of your opponent’s cup results in one (1) “Sip” of beer. Since a Sip equates to one fifth (1/5) of one (1) beer, five (5) unsaved Hits constitutes one (1) full beer.
A Sink, however, requires the sunk-on team to consume the remaining beer in each player’s cup. If the cup is full, that means a Sink is equivalent to five (5) unsaved Hits in drinking volume; on the other end of the spectrum, a Sink could be equivalent to merely one (1) unsaved Hit. This means that, on average, one (1) Sink – in terms of drinking volume – is worth three (3) unsaved Hits, or 0.6 Beers.
We also need to factor in that each player on a team must drink, meaning that one Sink on a full cup actually generates two beers, not one.
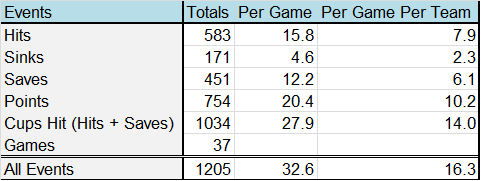
These beer volume estimations allow us to roughly estimate the amount of beer that was likely consumed during the entire Brother Pi Invitational Pong Tournament:
((171 Sinks x 0.6 Beers/Sink) + (583 Unsaved Hits x 0.2 Beers / Hit)) x 2 cups per team = 461.72 Beers
Damn, that’s a lot of Beast – basically three entire kegs. That doesn’t even factor in things like Off-the-Table-Serves, Ceilings Hit, or Rebuttals – all of which would have added to that drinking total.
What about per game though? Per Player? Per Team?
461.72 Total Beers/37 Games Played = 12.48 Beers / Game
(12.48 Beers/Game) / (4 Players/Game) = 3.1 Beers/Player or 6.2 Beers/Team
Fun stuff.
Beer Score
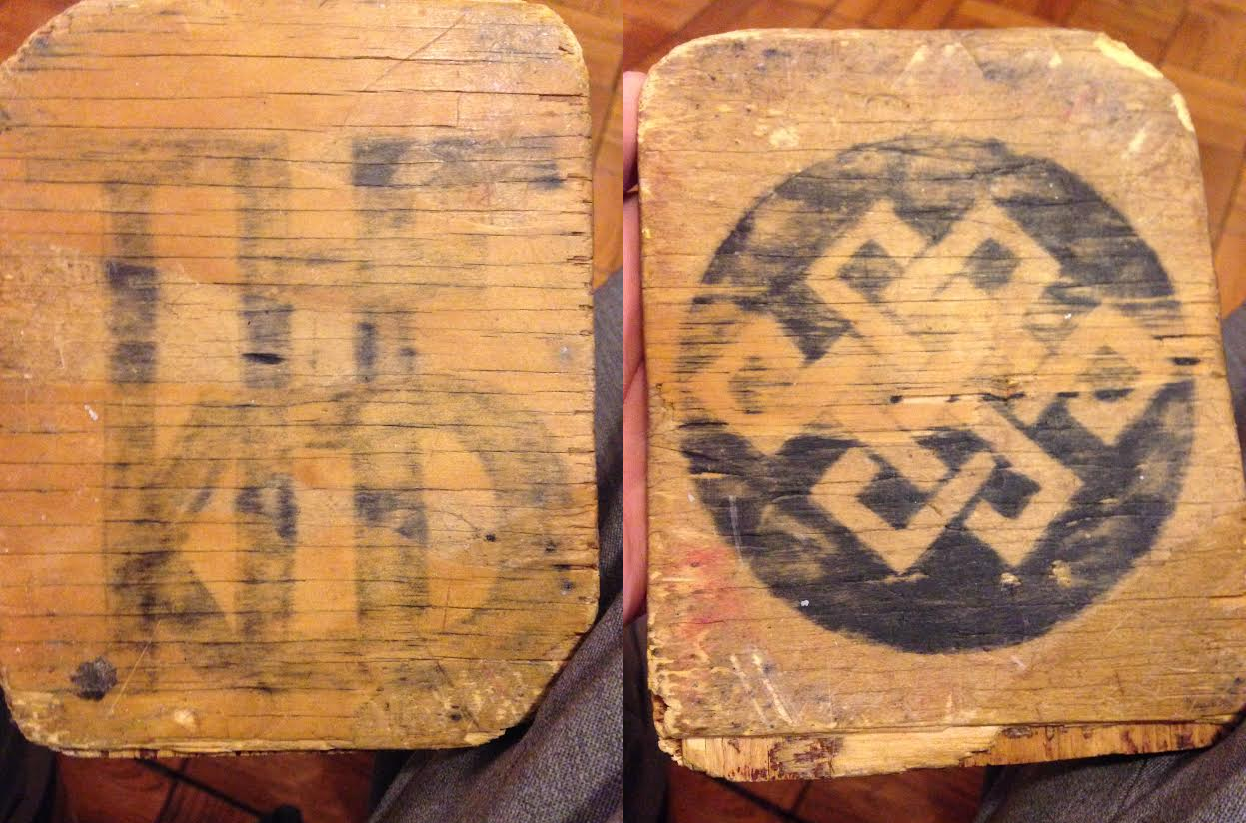
A little worn out, but it’s aged with grace
The reason I started thinking about beer volume in the first place was to try and make sense of which team and player performed the most effectively on offense. Obviously, the number of Points scored is significant, but so too is the amount of beer generated. What I mean by that is, a Sink in DKE rules is worth the same in Points as an unsaved Hit, but it is surely more valuable to your team to Sink – not only because Sinks cannot be saved, but also because they force your opponent to consume more alcohol.
Putting together that metric would require taking a look at a large set of individual game data and building a win expectancy model to understand how much more likely you are to win based on each Sink, and comparing that to the win expectancy added when you Contact a Cup (Hits + Saved Cups). In theory, you could basically do this for every Event and construct a comprehensive formula that would spit out one number telling you how good someone’s performance was – essentially the PER of Pong.
While this type of analytics actually strikes me as incredibly interesting, sad as that is, we just don’t have the data points to run those types of regressions. What we can do, though, is look at what I am going to call Beer Score – the same calculation I performed above, but rather than looking at the entire tournament, I’m going to break that down by player and team.
This, for me, is an unreasonably exciting new statistic. I’m basically the Kirk Goldsberry of Pong.
NB: This time around, I’m not factoring in the presence of 2 cups per team. I thought it would be more intuitive to think about it from the perspective of how much did that player force a single other player to drink on average.
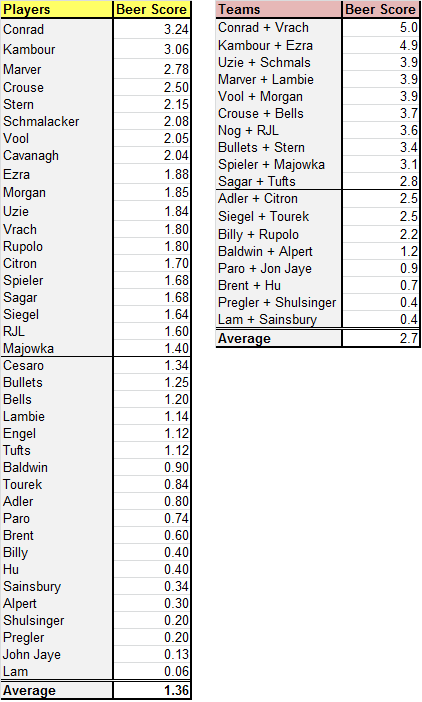
Congrats to C-Rad, and to C-Vrach as a team. It looks like their paddle-slap high-fives paid off.
Tableau
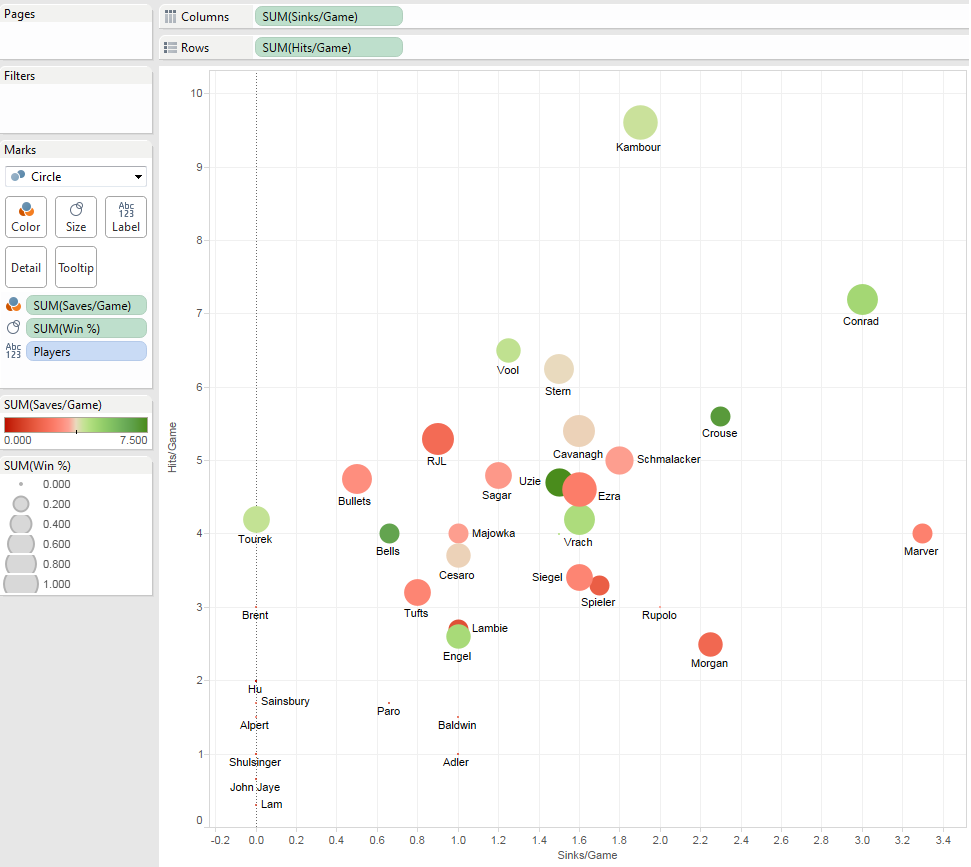
Randomly enough, this entire Blogcat actually began because I stumbled across, and downloaded a free trial version of, the data visualization software Tableau. Plugging in the numbers leads to some pretty cool stuff:
Player Analysis:
Team Analysis
What I got out of this is that House-Crouse was a Top 5 performer in an astounding number of major categories:
Saves/Game (2nd)
Sinks/Game (3rd)
Points/Game (3rd)
Beer Score (4th)
Hits/Game (5th)
Really, the only important category he wasn’t elite in was the most important one – Win Percentage. Incredibly underrated.
Correlation
In continuing to play around with Tableau, I investigated the correlation between various metrics and Win Percentage.
NB: I had to exclude from these charts all teams that lost every game, as they were skewing with the trend lines.
Hits
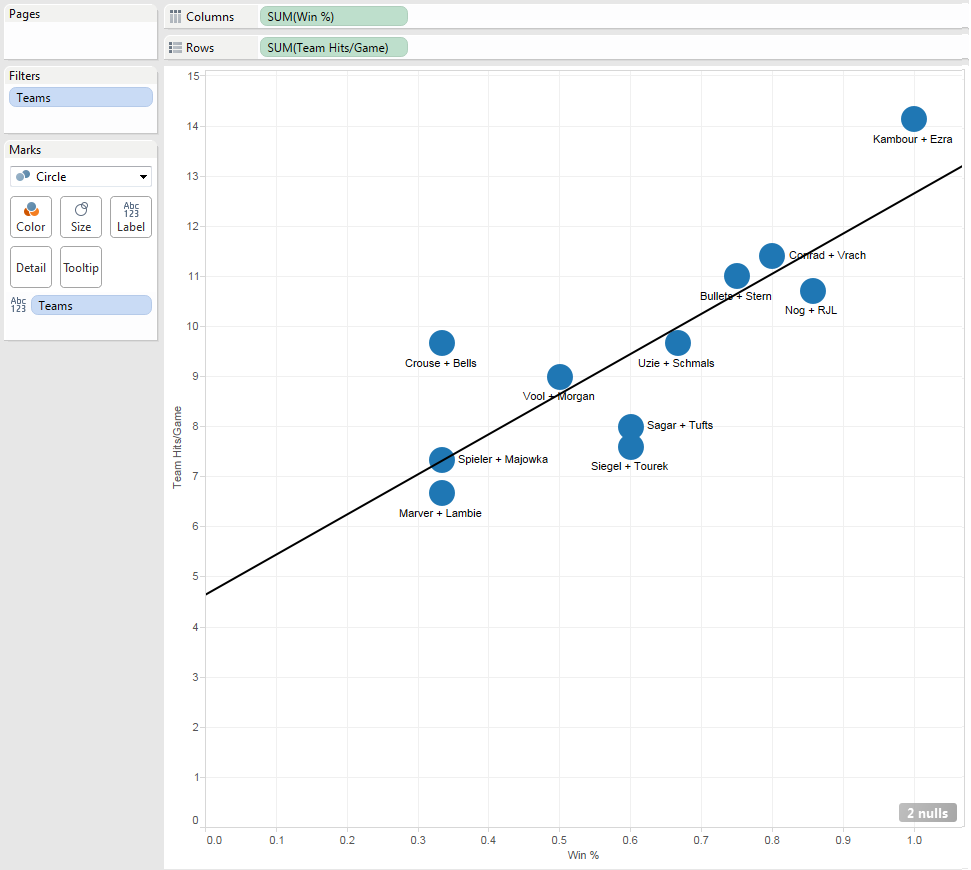
That trend – the more Hits you have, the more likely you are to win – is very strong, and makes a whole lot of sense.
Saves
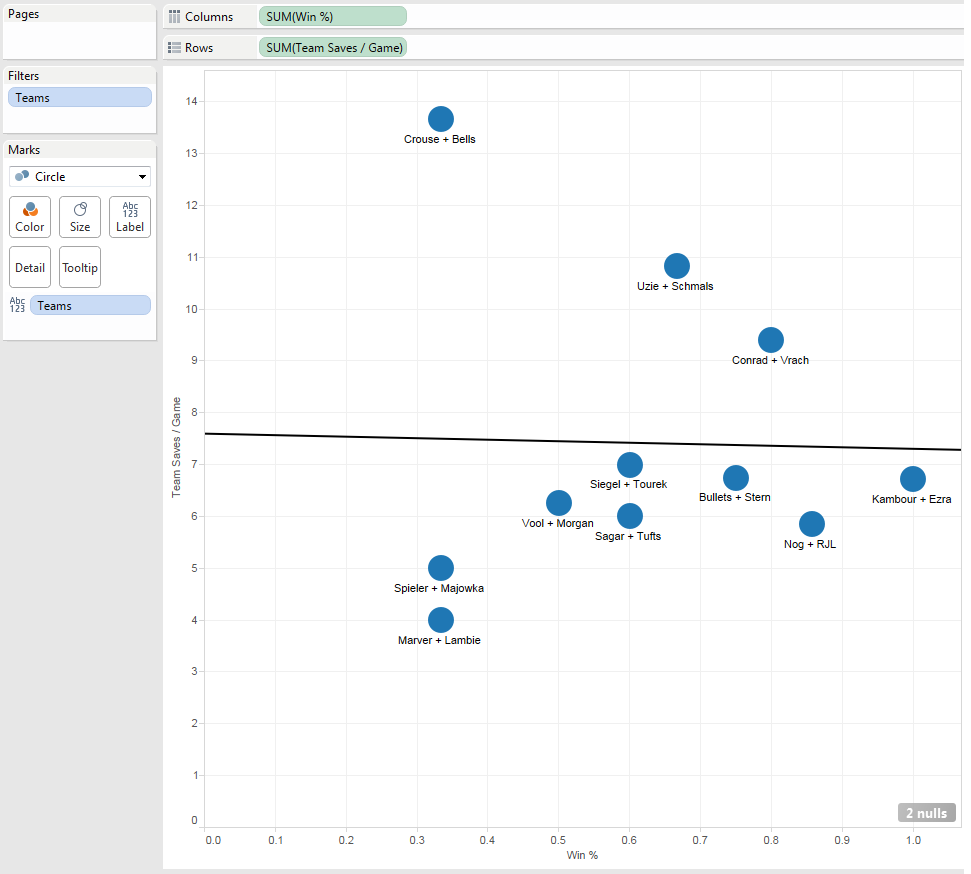
This doesn’t really surprise me that much. As covered above, Saves / Game at this sample size isn’t overly representative of your Saving skill.
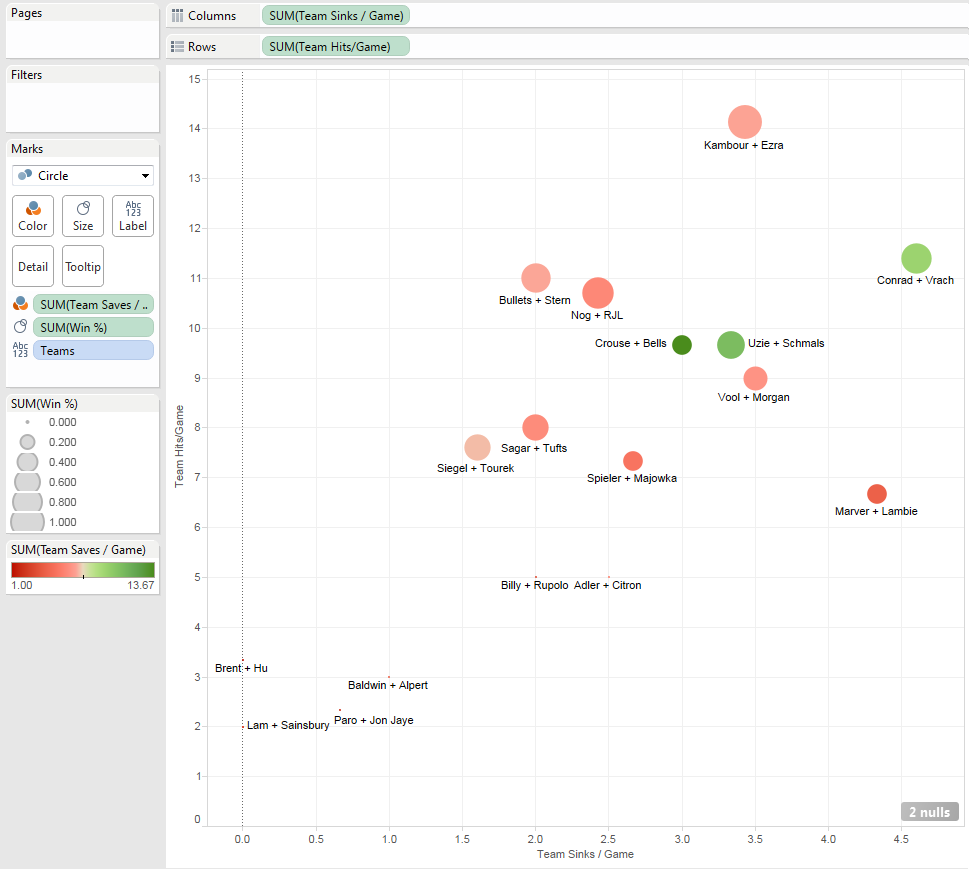
Sinks
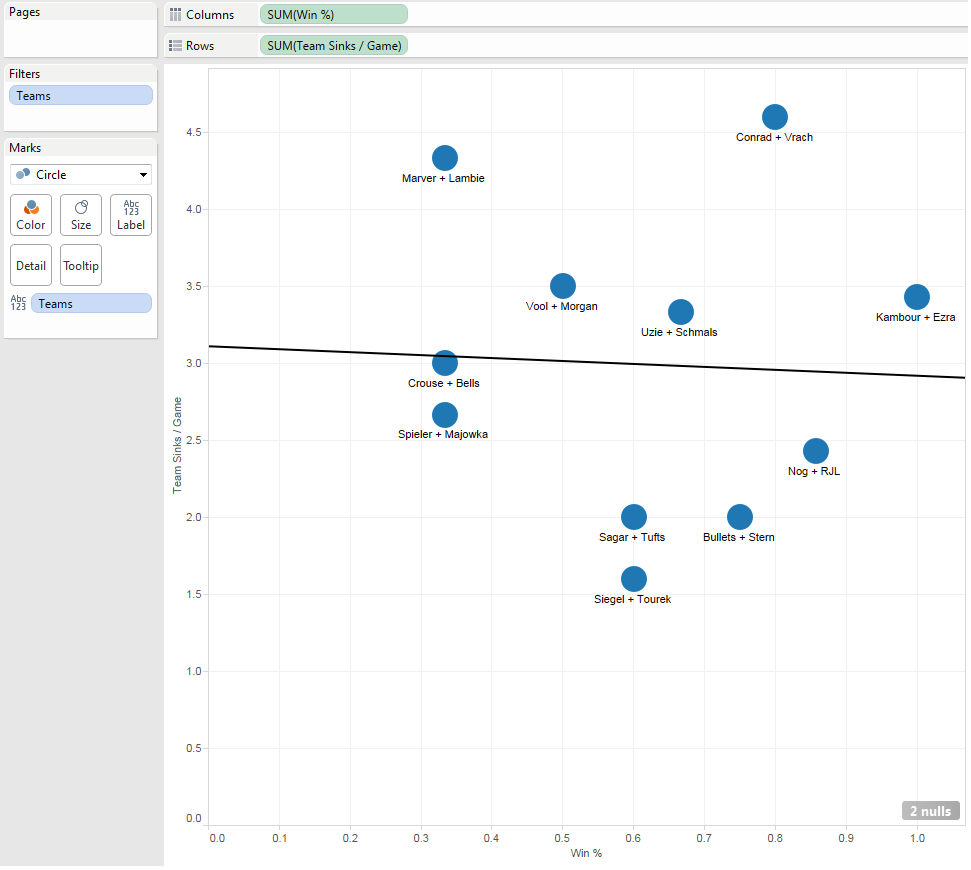
Well, THAT’s surprising, right?
At least, it was for me intuitively, but then I thought about it a little bit more. Sinks/Game, and Saves/Game, might actually be decent statistical indicators if our sample size were higher, but it’s not. Some of these teams played as few as three games, so statistical “outliers” stand out to a large degree. This was bound to be true with Sinks especially, as they are the rarest outcome of all Events; remember, the ball only goes in the cup 14% of the time (48% Hit, 37% Save).
Over time, the wheat would separate from the chaff based on which players were generating the most Events. In fact, you would likely see a direct correlation between Hit volume and Sink volume. I suppose someone might be more or less likely to Sink based on the type of spin his shot generates or the average loft on that shot (GET IT UP!), but that would likely be marginal at best.
We certainly don’t have the data to prove that even that type of marginal advantage would exist, though. I mean, of all the players who had at least one Sink in the tournament, look at how Sink % manifests itself.
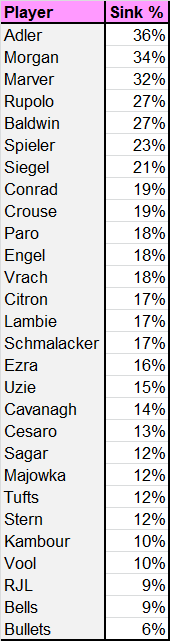
I think it is unlikely that Adler is three times more likely than Stern to Sink for any given Event.
Total Projected Offensive Points
What I do think we can do, though, is take a look at Total Projected Offensive Points – a second new formula which I would argue is the best descriptor of offensive performance (during Brother Pi) that has ever been created. It is essentially a calculation of how many points a player was likely to produce for his team on the offensive end during an average game against an average opponent.
NB: I certainly am not arguing that this is a comprehensive forecast of the quality of a player. So much more goes into defining that. Factors like Save Skill can be obvious, or instead incredibly subtle, like understanding when to catch a Doobie and when to rally it back.
The non-defensive elephant-in-the-room with this stat is the lack of representation of Unforced Errors (UFEs). Across all 37 tournament games, the average team produced fewer than 10.2 offensive points. Given that at least one team reached 21 points in every single game, it’s pretty clear that staying mistake-free is absolutely critical. Arguably the most valuable thing a player can do for his team is to not beat himself, so please keep that in mind when judging these numbers, and for God’s Sake – keep the ball on the effing table.
The other challenge with this metric – and, in fact, all these statistics – is the continuity of each player’s teammate. Certainly you’re competing against the opposing team, but you’re also essentially competing against your own teammate – both teammates can’t sink on the same point. An extremely wide gap in talent levels will likely artificially lower player A’s statistics while at the same time increasing Player B’s. If we were to truly measure individual player performance, we really should be pulling data from games played with a diverse set of teammates. Instead, we will have to settle for what we have.
One last issue is, of course, sample size. Nobody played more than 7 games, and most teams played far fewer.
Anyway, as I argued above, certain players are more likely to score points than others depending on ability, but in theory, no player is more or less likely to have Sinks be a higher percentage of those points (Sinks/Hits). Similarly, no player is more or less likely to have his Cups Contacted be Saved – no matter how good you are, it is likely that your shot was Saved 43% of the time. Essentially, no matter how good you are you will only score points on 57% of your Contacted Cups.
By using that ratio, we can project how many Cups Contacted (Hits + Saved Hits) each player was responsible for.
Projected Cups Contacted = (Hits/Game) / 0.57
We then add the number of Sinks to that number, and finish by multiplying that grand total by 63% – the frequency that a Point is scored, either via a Hit or a Sink, whenever an Event occurs.
TPOP = (Projected Cups Contacted + Sinks/Game) x 0.63
When you crunch the numbers, here’s how they come out:
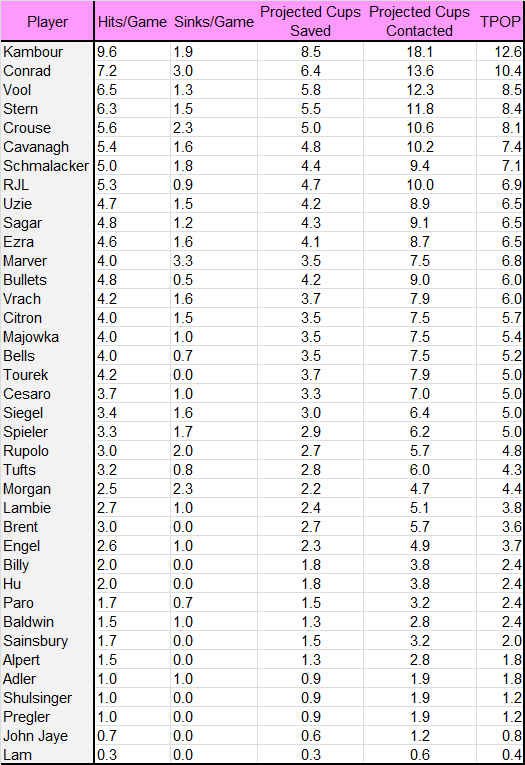
#THE_KID #395