This Blogcat is the third and final chapter in my analysis of NogFest, a Pong tournament hosted by my friend Nog during the last weekend of May this year. If you need to get caught up on Part 1 (which focuses on the merits of shooting vs. serving) or Part 2 (which breaks down tournament-long player performance ), I encourage you to do so. Today’s post will focus specifically on investigating stats on an individual game basis. After which, I swear, I’ll chill out on pong for awhile.
Before we jump in, let me remind everyone of the games played, and the order in which they were played, with the winners of each listed in bold:
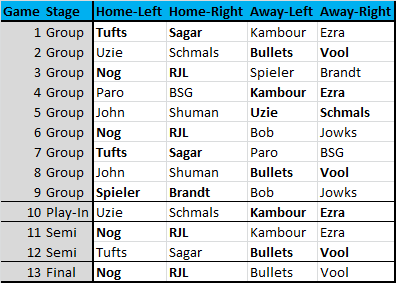
I thought this bracket would be helpful to include because a lot of the stats below use individual names in conjunction with game numbers. For instance, when the chart below says that Nog 3 had five sinks in one game, that means that Nog, in Game #3, sunk five times against Spieler and Brandt. Capisce?
Let’s do this.
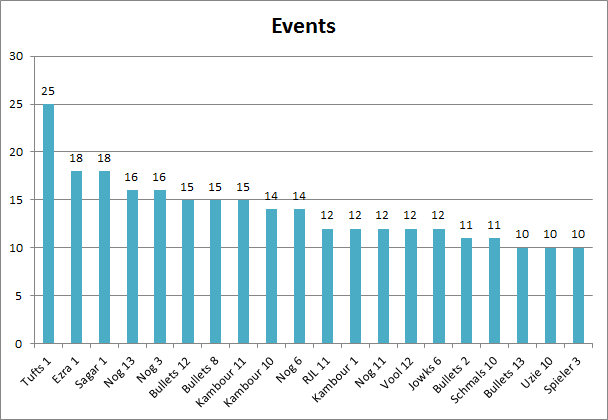
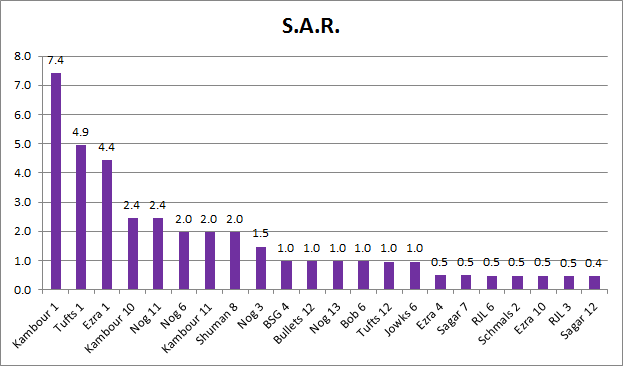
As with last time, let’s start by investigating some fairly standard volume-based stats, beginning with the metric I referenced just now:
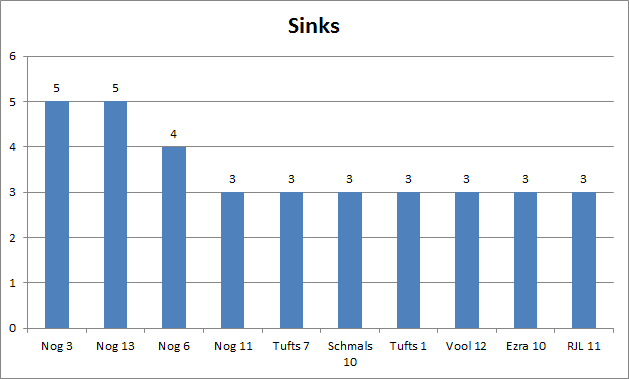
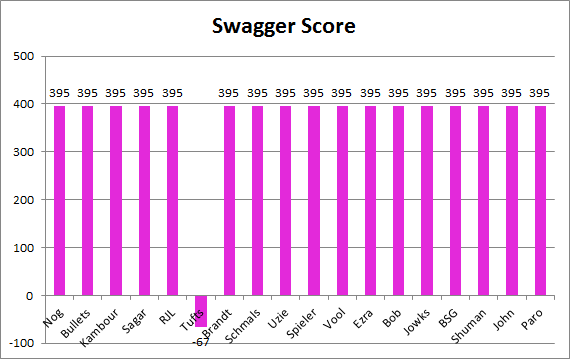
Holy 395, Nog. That’s just not fair.
Why I think a top 10 worked nicely for this particular graph is that only 10 of the 52 performances (13 games x 4 players) generated 3 sinks or more; every performance not on this list had 2 or fewer, with 11 of them generating 2 sinks exactly.
What’s interesting about that 3+ sink group is that they went 9-1 in their games. The sole loss came from Schmals 10, but he was facing off against Ezra 10, so somebody had to go down. As we try and better understand numbers that lead to victories, it might be the case that having a player surpass the 3-sink threshold in a game gives you fantastic odds to win the game.
Obviously the sample size is extremely small, so we can’t say for sure whether that threshold has significance, but the early signs at least are interesting to consider; at the very least, it would make sense that the more sinks one had, the more likely one would be to win.
Here are some more numbers to ponder:
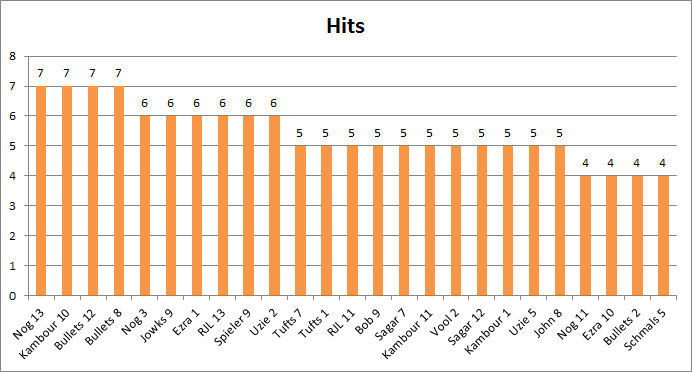
That’s a weird looking graph, and really not that interesting, but we always look at Hits, so I figured I’d include it anyway.
This one, on the other hand, is definitely cooler:
Woah. Talk about an outlier, Tufts. Nice work.
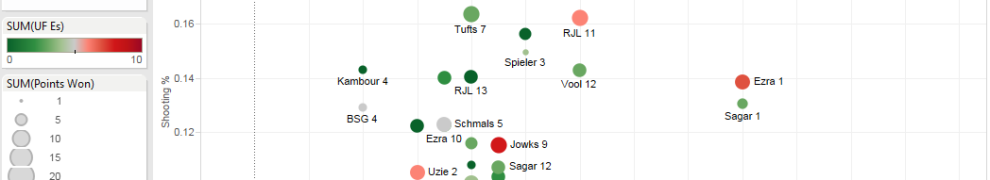
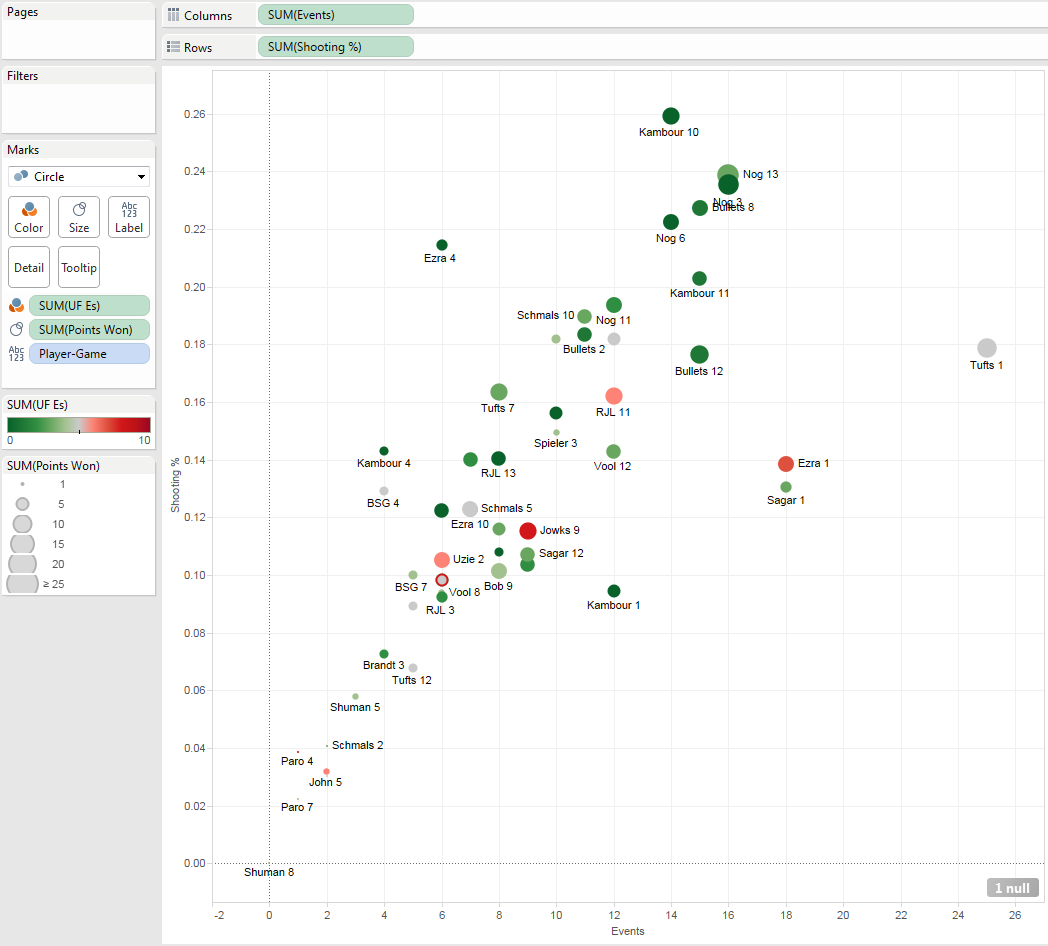
From a purely offensive standpoint, the last thing it probably makes sense to look at is shooting percentage – who shot the most accurately across an entire game.
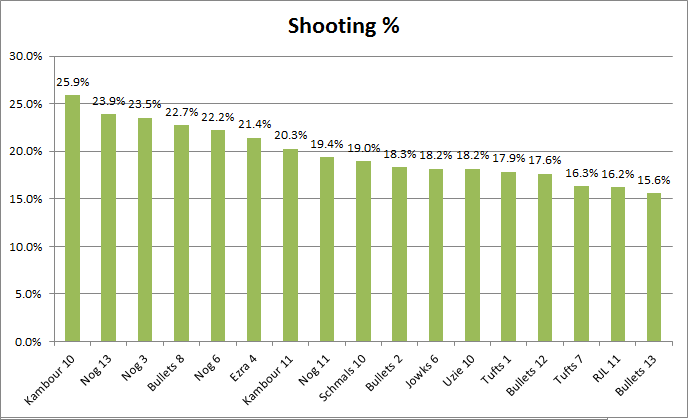
Booya. I’ll take it.
There are a number of interesting things about the chart above. One is just how difficult it is to contact or sink on more than 1/5 of the shots that you take; only 13.5% of all performances were able to do that. Furthermore, only 4 players were able to do it at all, and only 2 of those were able to do it twice.
Speaking of recurring excellence, all four of Nog’s games appear on that list. Not only is he a model of accuracy, posting 3 of the top 5 most accurate games (and 4 of the top 8), but he was also a paragon of consistency; his most accurate game was only 4.5% more accurate than his least accurate game. That seems pretty crazy in general, but it becomes even more so when you compare it to some of the volatility that occurred across the rest of the tournament.
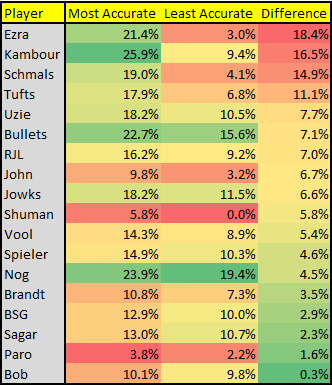
What I picked up on here is that the players, other than Nog, who contributed the most accurate single-game performances also generally led the tournament in variability. That makes sense for two reasons. One, it’s hard to sustain elite performance. Two, when you start high, you just have further to fall.
One other thing you might notice is that Nog’s worst shooting performance was more accurate than the best shooting performance of all but 3 players. No matter how you look at it, that’s tough to beat, which is why it’s not surprising he and RJL ran train through the tournament. To have beaten him, you basically would have had to excise all UFEs to maximize your Net Rating.
Let’s take a look at some of the standout performances from that perspective:
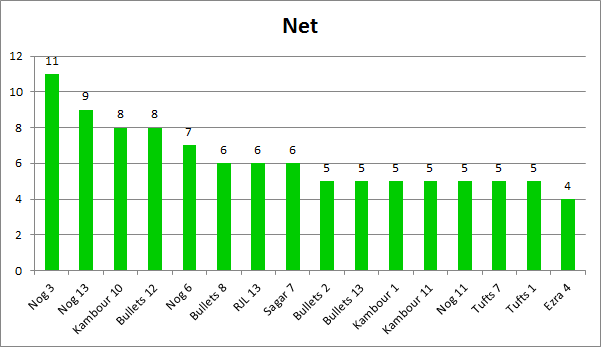
That’s some quality play right there, and it goes a long way. In fact, every player who posted a Net Rating of +6 or better ended up winning that game. You can certainly still lose by playing that well (some of the Friday night “friendlies,” not shown here, can attest to that), but it’s just a lot to overcome.
I don’t usually highlight poor performance, but in this case I figure why not – let’s also take a look at the opposite end of the spectrum.
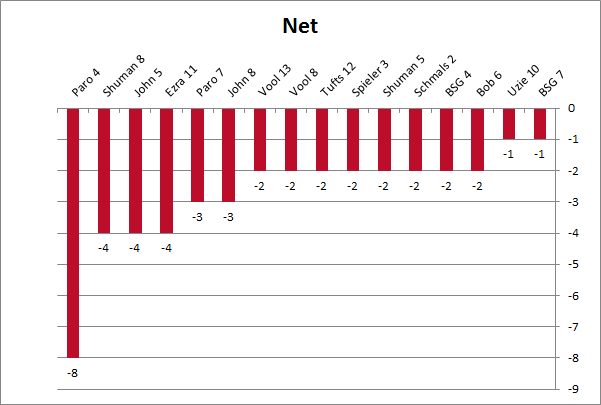
You might not be surprised to hear that these guys didn’t win quite as often as the previous group. In fact, if either teammate puts up a negative Net Rating, it’s incredibly difficult to win. This cohort, plus the 4 performances posting a net neutral (Ezra 1, Jowks 6, Jowks 9, Uzie 2), only managed to win a single game – Vool 8 (-2). That game, though, was balanced out by playing with Bullets 8, who was a +6, and against John & Shuman 8, who were a combined -7.
The lesson, as always: keep it on the table.
Congrats to Ezra, Sagar, Nog, RJL, Bullets, Brandt and myself for going entire games keeping it on the table. That’s what I like to see.
When you combine all these different stats, you can start to wrap your head around who played the best offensive game of the competition:
I guess it’s still up for debate, but I think Nog’s first game might have taken it, with his performance in the final being a close second – ultimately losing out because of his 3 UFEs.
What do you guys think?
Defense
Offense isn’t the only consideration, of course, so let’s hop on our winged sun-disks and fly over the divider to the defensive side of the table.
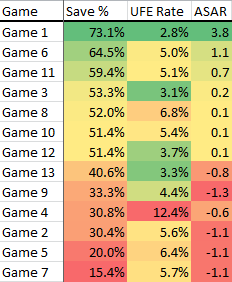
As has been noted on many occasions, there’s an inherent conflict between efficiency and volume when measuring defense, and this issue makes it difficult to rank the quality of performances. See, as evidence, the table below, which illustrates the 22 defensive performances in which a player saved more than half of his save opportunities:
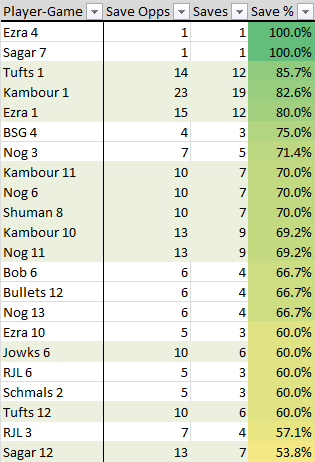
As you can see, efficiency cannot be the only factor weighed – the best two performances by that metric alone kept a clean-sheet, admittedly, but Ezra 4 going 1 for 1 in saves strikes me as less impressive than Ezra 1 going 12 for 15.
The other thing that’s problematic about micro-analyzing save performances is that save opportunities occur across a wide range of difficulty. For instance in game 3, theoretically, RJL’s 7 save opportunities might have been far more difficult, and his 3 saves far more impressive, than his partner Nog’s 4 saves on the same number of opportunities that game; we don’t know, though, so no matter what, Nog’s stats come out better at this tiny sample size. To combat this issue, an anecdotal difficulty ranking system, 1 through 10, has been discussed and used in the moment to judge save performance in prior games, but it’s certainly never been systematic or cataloged in any way, and you’d be hard pressed to argue that there wouldn’t always be a certain amount of subjectivity inherent with that type of gradation. As such, despite the appeal of a difficulty scale, we’re left evaluating each save opportunity as equal.
However, even though we can’t practically tackle that issue, I think saves & save rate metrics still do a pretty good job telling you who played well defensively. The only hard part is, again, striking the right balance between efficiency and volume, as a defender isn’t exactly in total control of how many save opportunities he faces.
Comparing Tufts’ game 1 performance against my own from that match-up, which I think were pretty clearly the two best performances from a raw statistical standpoint, is the perfect thought experiment to illustrate this conflict. Among all qualified (i.e., not going 1 for 1) performances, Tufts 1 came in as the most efficient, and did so on the second most save opportunities in the tournament – 10 of 12 on saves. Kambour 1, however, came in as a close second in save rate, but produced 7 more saves than Tufts 1, primarily because there were 8 more save opportunities (by far the most in any game).
Which defensive performance would you take? I really don’t have an answer.
Even looking at Saves Above Replacement, while interesting, doesn’t really help solve the dilemma, as it just doesn’t feel like it gives Tufts a truly fair shake – after all, I would have had to convert all of my next 5 save opportunities just to tie his save rate.
Again, the inherent problem is that a defender isn’t able to totally control for the number of chances he faces. It’s not Tufts’ fault that he faced 8 fewer opportunities than I did (or maybe it is his fault because he’s the one who hit against me in that game so much, that asshole).
What is interesting, though, is that while most of it is outside a defender’s control, it’s not as if a defender has no influence at all. In reality, simply being good at saving will increase your number of save opportunities. Look at this graph below, which calculates the trend line of save rate over save opportunities.
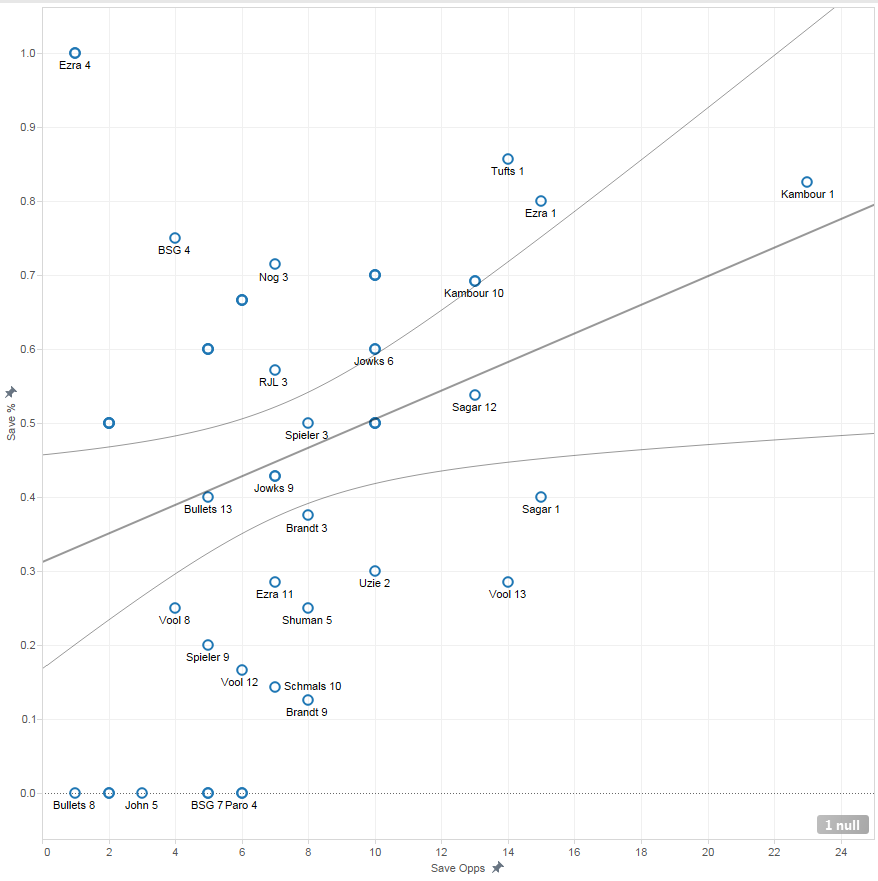
<Equation: Save % = 0.0193183*Save Opps + 0.31192 ; P Value = 0.0265185>
Yes, even if you exclude all the 0 save performances, the trend line still stays positive.
Sure, the sample size is small, but this correlation strikes me as fairly intuitive. It makes sense that the more times you save, the more times your opponent will hit the cup. I mean, I don’t think it’s completely random that of all qualified performances, the three most efficient save rates also faced the three most save opportunities.
As for the question of who played better defensively in that first game – Tufts or myself – maybe we should follow the Black Knight’s suggestion and “we’ll call it a draw.”
…….
………………..
Actually, fuck that. My SAR was dominant, my Save Rate trailed by a negligible margin (he misses his next one, I’m way ahead), and I didn’t hit a single shot off the table in comparison to Tufts’ 5 in that game alone (UFEs aren’t technically defensive, I know, but are still of the same spirit because they also give points away).
Victory is mine!
Defensively, anyway. We still lost the game.
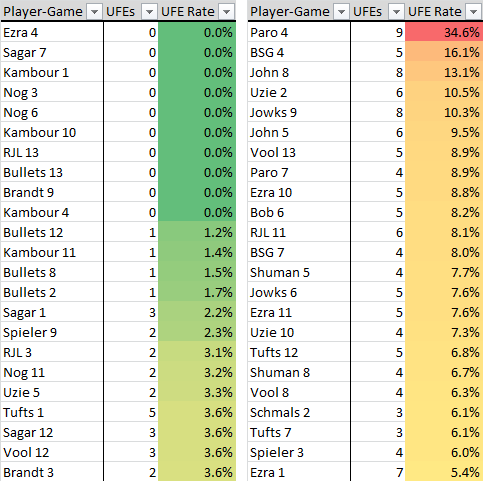
Wherever you stand on that particular debate, I want to put forth an idea for a really cool concept that’s the pinnacle of keeping your opponent off the score sheet. Put simply, it’s any performance with no UFEs and a 100% Save rate.
I call it the Flat Hat Club – pong’s equivalent of baseball’s perfect game.
I have little doubt it’s been done before, but right now the club only recognizes two members – Sagar and Ezra – who both had 0 UFEs in the games in which they posted clean sheets, going 1 for 1 on saves. We would call this a “Flat Hat 1.”
That’s a record that needs to be broken. Not that doing so will be at all easy – the opponents in those games (BSP both times) had higher combined UFE rates than shot rates (6.3% shot rate to 8.4% UFE rate against Sagar; 8.8% shot rate to 24.6% UFE rate against Ezra).
Still. Somebody should be able to post at least a Flat Hat 2.
Anyway, the end-all, comprehensive performance evaluation time is here.
By combining Shot Rate, SAR, UFEs, and Net Rating, you can take a pretty good look as to where each performance fell overall, factoring in both the offensive and defensive side of the table:
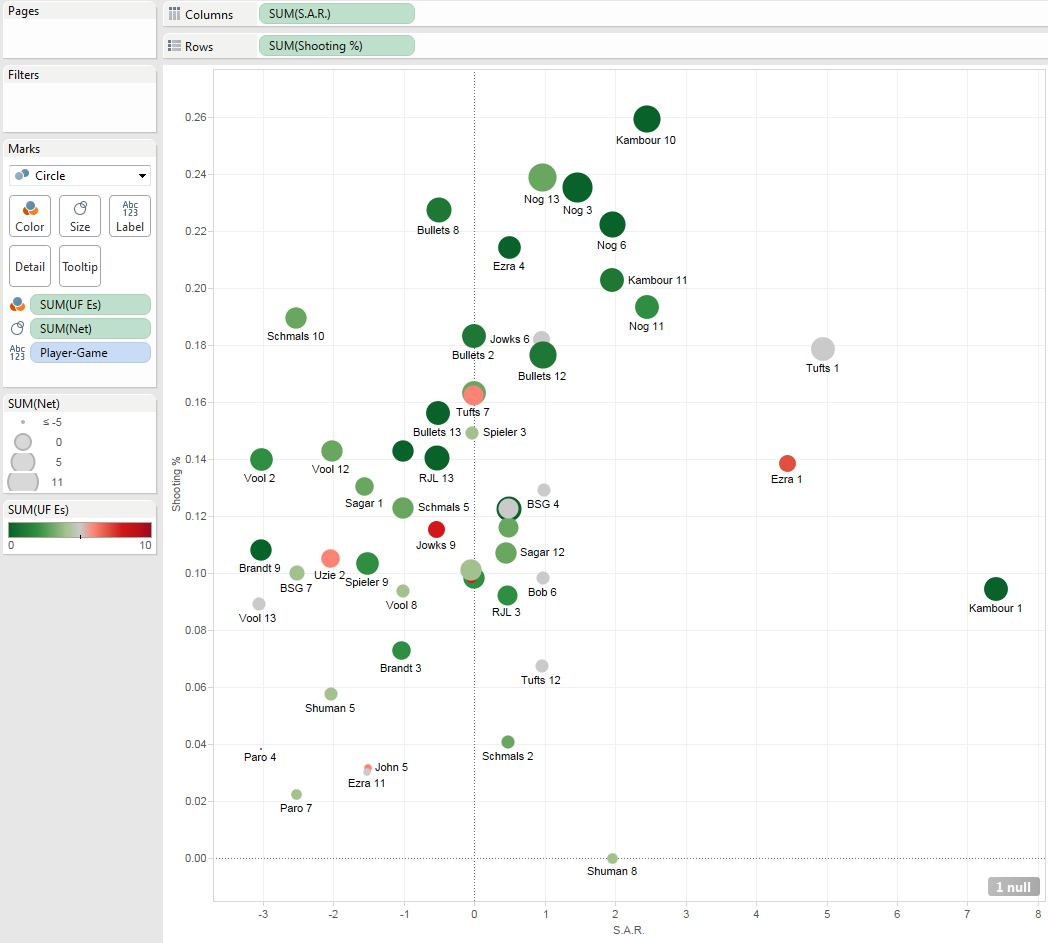
Nog 3 and Kambour 10 are your leaders in the club house. Class of 2012, on your faces.
Whole Games
For ease of reference, I’ve again included the bracket here:
So far we’ve examined individual player performances, but now I want to take a quick look at which game was simply the best played as a group. This chart here, combining Save Rate, Shooting %, Total UFEs, and Net Rating, gets at that particular idea – which game was played at the highest level.
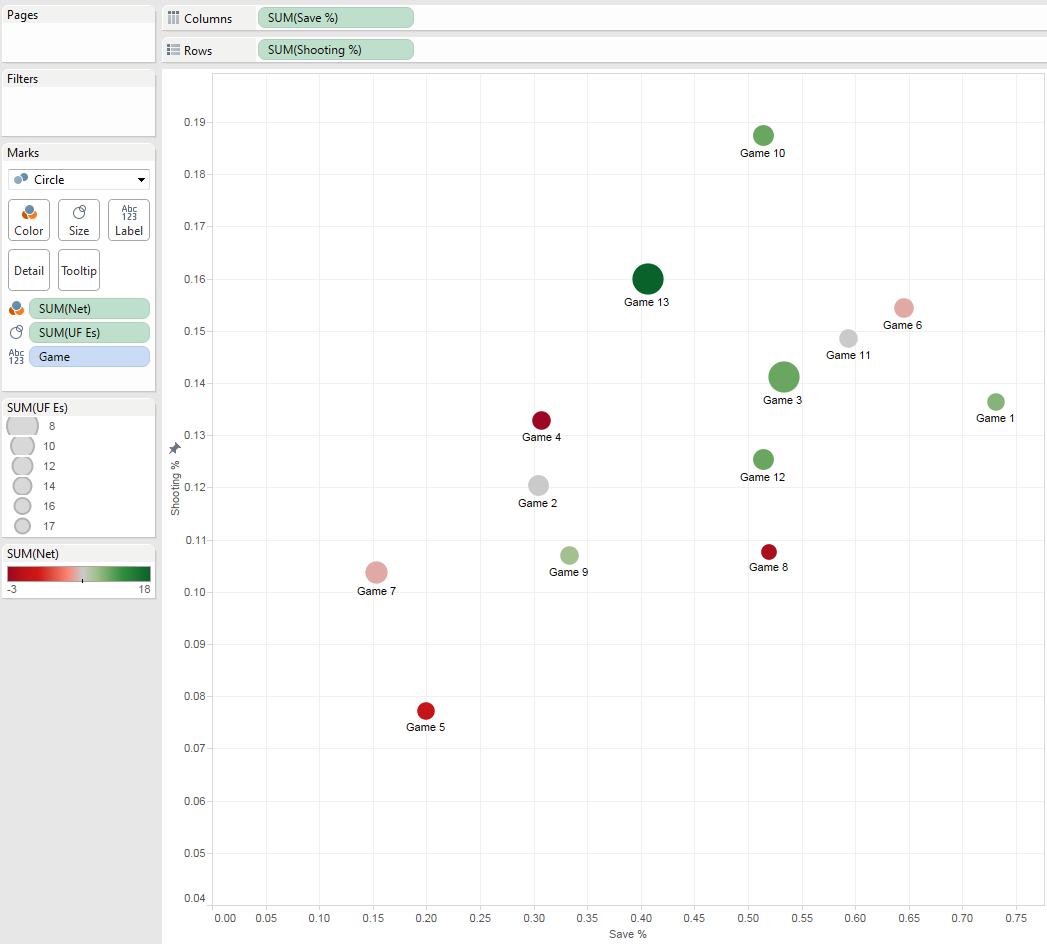
It looks like the play-in game is a strong candidate, given that it was by far the most accurate game (18.8%, 2.8% more accurate than the second place finisher). However, I think the Tournament Final itself might have been the most well played, since it had a total Net Rating of +18, leading the tournament by +6; the title game being the best would be sort of fitting after all, it being the game that decided the championship.
Before I wrap things up, I want to call attention to one game in particular, one that was not the most well-played game across the competition; in fact, the players in the game only shot 13.6%, which was 6th out of the 13 games. Instead, I want to point it out because of how big of an abnormality it was in contrast with its peers.
The first game of the tournament, as you might have noticed throughout this post, was a complete anomaly in comparison to the rest of the games played. To start, the top 3 (qualified) individual Save Rate and SAR performances all came from that game. That’s largely why, as you can see below, Game 1 finished 1st in UFE Rate, 1st in SaveRate, and 1st in SAR – those last two by a wide margin.
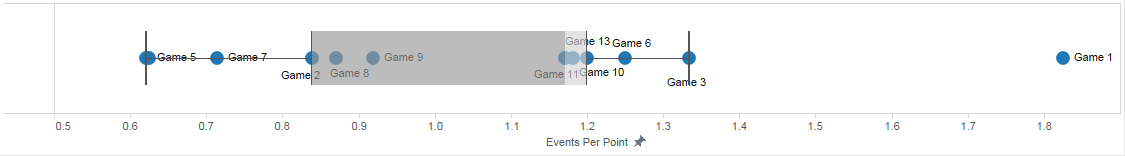
When you combine the fact that it saw the lowest Save Rate with the lowest UFE Rate, you get an astronomical lead in Events Per Point – a new stat that I would argue is a great proxy for, as it were, an “Entertainment rating.”
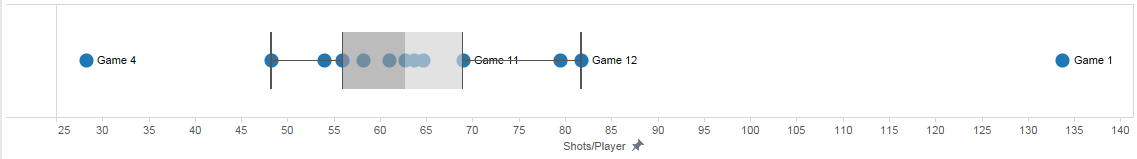
What’s also pretty wild is that, when you account for the highest save rate and a middling shooting %, and that the game ended up finishing 21-19 so you just had a lot of points, there ended up being a hell of a lot more Shots Per Player than we typically saw:
I guess that’s what happens when you have rallies like this:
Tufts’ and my 5 straight saved hit/save sequence was easily the longest streak of its kind that I came across during my game tape sessions. That stretch alone basically explains my game 1 saving performance outlined above.
Even further, this game was by far the most competitive in the tournament from a final score perspective, finishing with the smallest point differential of 2:
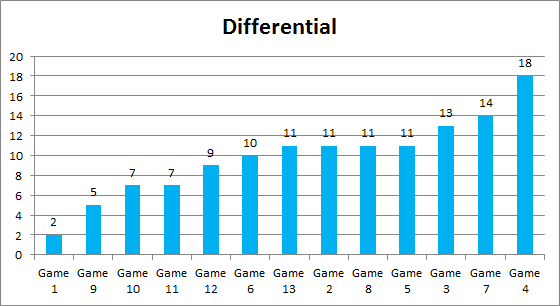
I think it’s a bit unusual how few games ended up being close at the end, but what in the hell is a fella to do? For every million I make, that’s how it ended up playing out.
The discussion of point differential coincidentally dovetails nicely to my final thought for now, which is that we are absolutely terrible at keeping track of the score. As far as I can tell from video tracking all 580+ rallies across the entire tournament (44.6+/game), four of the 13 games had incorrect scores – two teams won with 20 points, two teams with 22. That includes the all-important Final, which appears to have finished at 22-11. Even worse, one of the Friday “friendlies” I logged went into overtime in the moment, when in reality the score ended 24-19 (it probably didn’t help that there were a combined 11 sinks and 2 rebuttals). Even in games in which we get the score correct, we still make other mistakes; Game 1, for instance, saw Sagar take his team’s first service, with Tufts taking on the next two.
Such a serve hog. That’s probably one reason his swagger score came out so low:
Luckily, none of these errors screwed up who actually won or lost. At least, not in an obvious way like altering the score directly, but even the small things can make a difference. And we will make that crucial error eventually.
On one hand, that’s super frustrating, and ideally wouldn’t happen. To try and prevent these mistakes, we should try and take measures like using a whiteboard as a scoreboard, updating it throughout the game after each point, or perhaps designating an official scorekeeper, when we have the spare headcount, who would write things down for us. All things considered, that would be preferable.
However, even if that were realistically feasible, which will often not be the case, there’s something sort of nice that, as serious as many of us, myself included, take this game, we’re just going to somehow fuck it up. It’s inescapable.
After all, as Omar Little once said, “it’s all in the game tho, right?”