
This Blogcat is a continuation of some posts I’ve previously written regarding my fraternity’s game of Pong:
The Brother Pi Breakdown
Pong II: Advanced Analytics
DKE Pong Rules & Regulations
Don’t Doobie
To bring everyone on the same page: at the end of May, my friend Nog hosted a Pong tournament called NogFest, with 9 different teams competing for ultimate glory. We set up a video camera to capture everything that happened, and I subsequently put in a number of hours logging stats. You can find my initial discussion of said competition, and my presentation of a controversial tactic, in the linked “Don’t Doobie” above if you need to catch up.
Today’s Blogcat will focus on exploring myriad statistics regarding tournament-wide performance, on both a player and a general level. Let’s dive in.
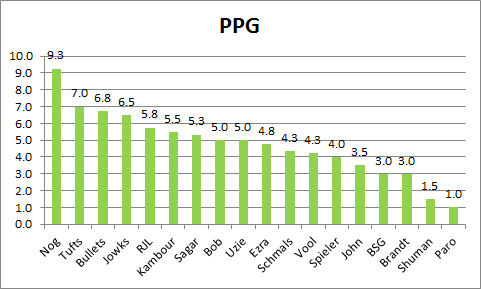
We’ll start with some classic per game stats.
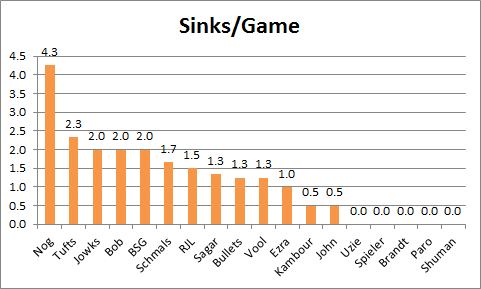
Damn it, Nog. That’s across four games, too.
Good stuff.
Shot Rate
While all that is definitely interesting, we didn’t record every single shot attempt simply to explore numbers we’ve looked at before. Instead, with our PongVU videos, we can plot every serve, UFE, save, saved hit, hit, sink, etc., and thus take a look at a lot more.
So. Let’s talk about shot attempts.
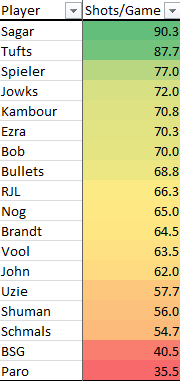
Leading up to NogFest, I had any number of conversations about the data we would be able to track, and total shots and shooting percentage were the ones I was most excited about. This was partly because everybody seemed to have a different opinion on how many shots it took on average to score an Event; some guessed 4 or 5, others guessed 8 or 10. Finally we had the opportunity to put some numbers behind it, and we now know that, at least on that one day, the average player shot 13.6% – 1 out of every 7.35 tries.
Here’s how players stacked up on an individual level:
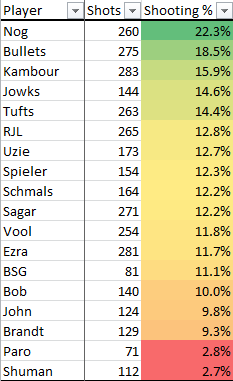
There are a number of different factors that are interesting about this. One is to just get a general feel for how often Events are occurring – 13.6% of the time.
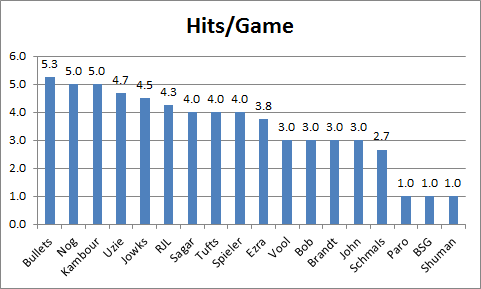
Another is to give us an alternative way of examining a player’s offensive performance. For instance, let’s look at Cups Contacted/Game (Hits+Saved Hits) and Events/Game (Cups+Sinks) in the way we would have before:
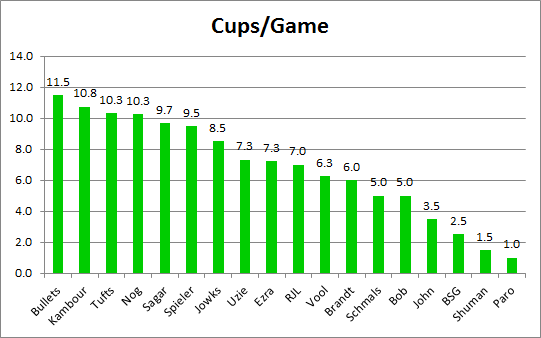
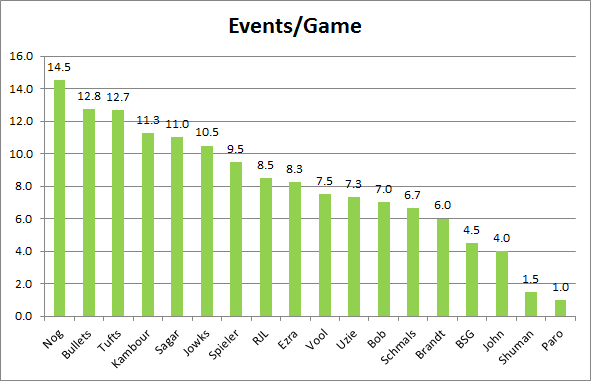
Here, you’ll notice Jowks coming in at sixth overall in Events/Game. That’s pretty respectable on the offensive end. When you look back at Shooting Percentage, though, you’ll find that he actually comes in fourth, narrowly edging Tufts, who finished three spots ahead of him in Events/Game. Jowks had two games to Tufts’ three, and averaged fewer shot attempts in those games, but he was still more efficient in generating Events.
Nice work, Crook.
The reason, of course, that Tufts had more Events/Game, yet shot ever-so-slightly less accurately than Jowks, is because of shot attempts per game.
These per-game numbers are obviously going to vary among teams based on, at the very least, the scores of the games in which they play (e.g., a 21-19 game will usually require more shot attempts than a 21-3 game). What’s crazy, though, is how it even varies player to player within an individual team.
Across two games, despite teaming up and never playing separately, Spieler averaged 12.5 more shot attempts per game than Brandt. That can be explained by a number of factors – save opps (which don’t count toward your Shot total), serving first, doobies on your serve giving you another serve, higher shooting %, etc. – and would inevitably become a smaller gap over a larger sample size, but it’s still freaking remarkable that even across just a few games there can be such a large disparity between teammates.
Serving
My last post dove a bit into Serving data, arguing for the idea that it’s more valuable to shoot off a doobie than to have an extra serve, as long as that doobie presents the player with a good shot opportunity (i.e., you should still catch it if bounces in a way that prevents you from aiming and getting a good shot off). Let’s examine serves a bit more now.
Nice work, Spiely D.
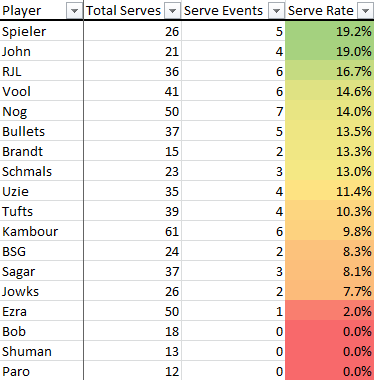
I was keeping track of what Events occurred off of Serving and how many Serve attempts everyone had (obviously – that’s how I calculated the numbers above), but I also monitored how many of those serves actually resulted in points. You can use that to determine how many “free” serves players were getting because of doobies.
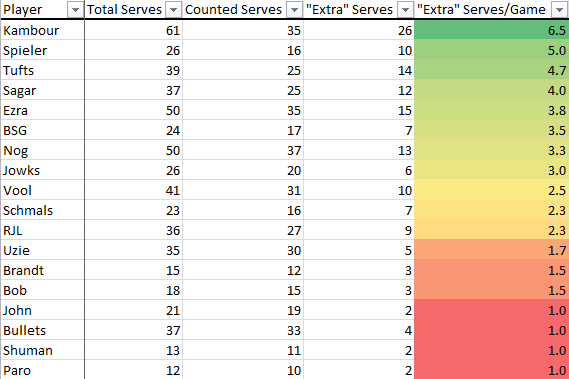
Considering Spieler led the competition in Serving accuracy, him gaining an additional 5 serves per game for himself is huge. Gotta love that garage ceiling.
What I also kept track of was who ultimately won those rallies when those rallies actually resulted in points.
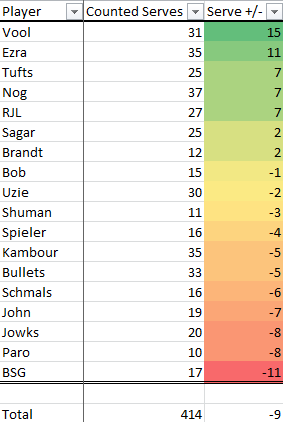
Honestly, I’m really not sure what to make of this overall -9 ratio. I’m now firmly of the belief that you want to keep the rally going if the doobie tees you up to do so, but I would never have suggested that having the serve is a disadvantage. At the very least, having the serve means you have the first shot, so even if it’s less accurate than a Rally Shot, you’re still the first mover, which you would intuitively think would give the server a leg up; lead-off batters typically lead baseball teams in hits, after all. I suppose each player’s sample size is still not that large, and that could skew things, but the overall N of 414 is getting up there, heading toward statistically significant.
Then, instead of looking at Serve Events, I looked only at Serve Points. There were 24 across the entire tournament, an average of 1.85 a game. Then I looked at Serve UFEs. There were also exactly 24 across the entire tournament.
That means that on the serve itself, we were a net 0 across the tournament. The -9 doesn’t seem as surprising, then, considering the serve returner is, from that perspective, actually getting the first shot from neutral. I suppose you still have to factor in Saved Serves, which don’t give the the returner the first shot, but there were only 32 of those all told. You would also think that service UFEs probably get cleaned up a little if everyone played more, but thinking that we’ll all start playing more often is probably unrealistic, and thus it’s more likely to stay the way it is.
Even so, that’s pretty bizarre. I’ll be curious to see how that plays out if we can do another one of these tournaments.
UFEs and Net Rating
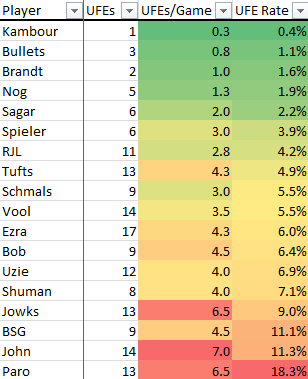
Speaking of UFEs, let’s take a look at how those broke down.
#The Kid #395
We all know that UFEs are enormously important, but that idea is further evidenced when you look at, not just how many Events you generated, but how many offensive points you actually scored – Points Per Game.
When I look at those UFE numbers, and the damage they do, I think about it this way. Tufts, by all accounts, played some great pong this tournament – he was third in Events/Game, fifth in Shot Rate, and his defensive performance, outlined in the next section, speaks for itself. But by averaging 4.3 UFEs / game, as opposed to zero, he turns an opponent like Bob (5.0 PPG) into Nog (9.3 PPG).
It’s not a perfect comparison, and Tufts still played really well, but that unarguably makes it a whole lot more difficult to win.
Another cool thing about UFE stats is that, when you combine them with Sinks, Hits, and Saves-Are-Saves – all the points you were directly responsible for – you can look at a new but fairly straightforward statistic: Net Rating.
Net Rating = Hits + Sinks + SavesAreSaves – UFEs
Essentially, you’re looking at how many points you gained for your team versus how many you directly lost (in this case, on a per game average).
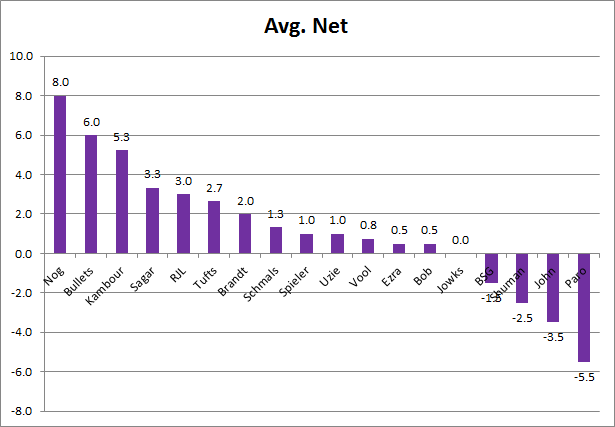
Why I think this stat is a solid barometer is that we can combine negative offense – UFEs – with positive offense in a way that balances both. Earlier on in this Blogcat, I was giving kudos to Majowka for finishing fourth and sixth in Shot Rate and Events/Game, respectively. And yet, because he finished third worst in UFEs/Game, all of the positive production he generated was largely negated.
Gotta keep it on the table, Crook.
There are certainly a number of problems with this specific stat at this small sample size. One that I want to call attention to is how dependent your personal Net Rating is on your opponent’s performance. Your opponent saving all your hit cups, for instance, will impact your Net for sure; in that way, playing a great defensive team can make you look worse.
But so too will playing a team that hits it off the table. For example, I put up single game Net Ratings of 5, 8, 5 and 3. My worst Net performance, though, came in the game when Ezra and I beat BSG and Paro 21-3. That point differential was inarguably great for our tournament standings, but because 14 of our 21 points were UFEs by the other team, Ezra’s and my Net scores, despite neither of us having a UFE of our own, don’t look so hot – we were only given the opportunity to put up a combined +7, best case scenario.
So for that reason, while I think Net Ratings are still telling (considering Nog killed it and he’s #1 here), take them with a grain of salt. A further reason to approach with caution is because Net Ratings only describe offensive production. They have nothing to do with the value a player brought on the defensive side of the table. Almost none of these stats have yet to go there.
Let’s do so now.
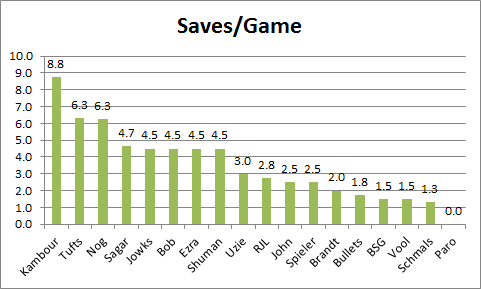
Defense
In analyzing Brother Pi data, we could only look at Saves/Game, which is, on a small sample size, a terrible way to evaluate someone’s saving skill. The reason this is the case is that we have only the raw volume of saves to look at, despite said save volume being so heavily influenced by the number of Save Opportunities that particular defender faced. Take Bullets and Vool as an example; despite the fact that they were teammates, Vool averaged, across 4 games, a full 4 more Save Opps than Bullets. That wasn’t even the biggest disparity, either.
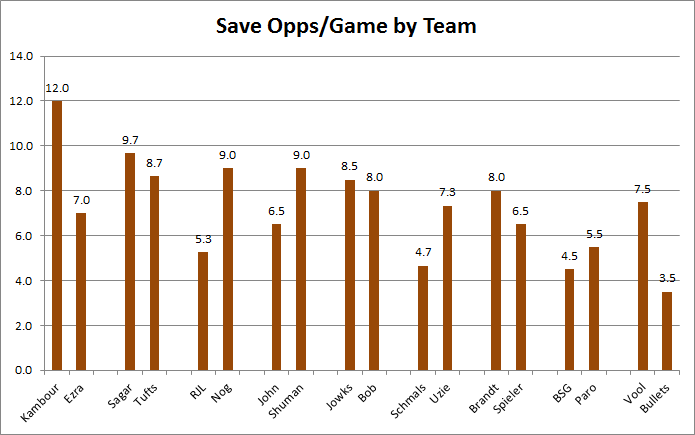
At least with Hits and Sinks, we know there are only 22 per team to go around (factoring in Live On, unless it’s OT), so there’s a more consistent range; Save Opps, on the other hand, could theoretically be infinite.
With Nogfest, we were thankfully able to capture both Save Opps and Saves themselves, and thus calculate the more telling Save Rate metric. Across the tournament, we actually did much better at saving (50.4%) than we did in both Brother Pi (43.6%) and the DKE Open (43.7%). That’s surprising, considering how the two previous competitions have virtually the exact same Save Rate. Anybody have any potential theories? Was it just that a lot of the novice teams, who aren’t as adept defensively, weren’t in attendance?
Regardless, here’s the breakdown for individual players:
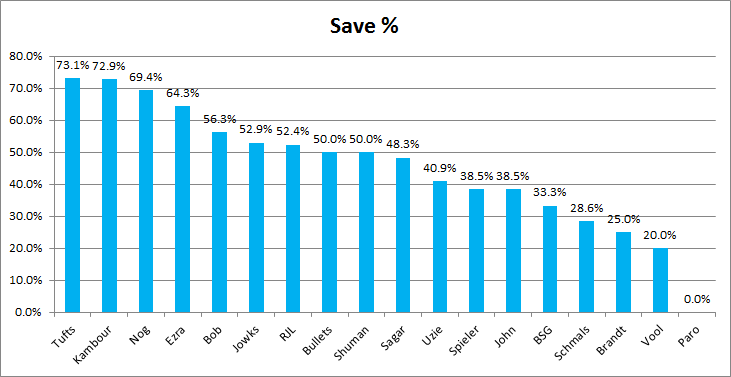
The tough part about looking at these numbers, though, is what’s difficult about many of them – lack of sample size. Even though all these stats are so fun to consider, and are so much more interesting and informative than the basic ones we were previously limited to, it’d be better if we had a full-on Pong league so we could stop qualifying everything.
<Side Note: What do you readers think would be the ideal format for a Pong league? I think it would be great to see the regular season structured like the English Premier League, in that every team plays every other team twice. I think that would be sweet even if it just ended there, making every game and point crucial, but obviously playoffs would be fun too. Maybe the top six teams advance, with the top 2 teams getting first round byes. Then, single elimination – wasn’t a fan of the Best-of-3 on the same day format. God, this sounds amazing.>
Due to the regrettable fact that a consistent Pong league is probably no longer feasible in our lives, we’ll thus have to get creative in balancing both efficiency and volume when we evaluate defensive performance. That’s certainly true with this limited sample, but even over time, efficiency, though it would become a much better indicator, still wouldn’t fully encapsulate the entire value created in a defensive performance – you need to factor in just how often that efficiency was called to task.
In the short term, for example, both Ezra and Sagar had the best single-game save rates, 100%. Yet that was because each of them went 1 for 1 on Saves in those individual games. They did all that was asked of them, it’s true, but does that mean they put forth a better defensive performance than Josh Tufts’ first game, when he went a stellar 10 for 12, posting an 85.7% Save Rate?
Even across the long run, though, it seems we might always need to take volume into account, because volume might not balance out over time. For instance, it would anecdotally make sense that the less accurate your partner, the more save opportunities you’ll face yourself. After all, a less accurate shooter, whose shot’s average distance from the cup is greater, less frequently forces the returner to get in a defensive stance, preparing for a potential save, in a way that prevents him lining up for and aiming the shot; as such, the returner would tend to be more accurate with his return, and the original shooter’s partner would face more Save Opportunities.
We also need to factor in volume because across the tournament’s 13 games, Left side players were hit against more often. It seems strange, I know, but Left side players (199 opps) actually faced a total of 17 more Save Opportunities than Right side players (182), for an average of 1.3 more save opps per game. That doesn’t sound like a whole lot, but converting that one+ extra save could make or break a close game.
As to why that positional difference exists, I’m curious as hell. One explanation is that Left players just shot better in general (14.7%) than Right players did (11.5%), and Left players serve and then shoot toward other Left players.
Maybe so, but they also shoot at Right players, so I’m not sure about that.
Perhaps it’s instead that Left players (57.3% for 114 saves) just saved a whole lot better than Right players (42.9% on 78 saves) – a 14.4% disparity – and that results in them facing more save opps; usually a Save return is still getting the rally back in rhythm instead of aiming an accurate shot at the cup.
In fact, maybe this trend doesn’t exist at all, because these numbers don’t allow us to say for sure if this positional difference is actually the case. With this sample size, there is a 35% chance that the observed difference is due to random chance, and not because the two sides are truly different. That just isn’t statistically significant.
That being said, it’s still 65% likely that the Left players will continue to get more Save Opps than the Right, so I figured I’d point it out.
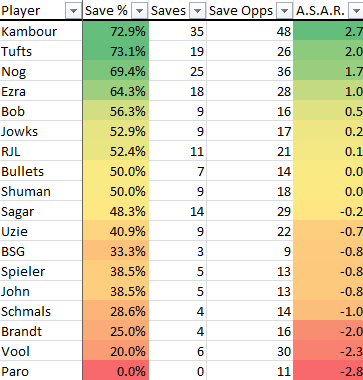
Whatever the reason, we still need to try and split the difference between efficiency and volume, and to do so, I’m suggesting another new statistic: Saves Above Replacement (SAR). This stat takes a look at how many save opportunities you faced, and then, using the tournament average Save Rate of 50.4%, projects how many Saves an average player would have posted when facing that number of Save Opps. We can subsequently compare how many saves that player actually posted, overall giving an estimation of how many more saves a player was responsible for than we would have seen from an average defender.
Saves Above Replacement (SAR) = Saves – (0.504 x Save Opps)
To be clear: Save Rate (over time) would be a better stat to use to benchmark how good at saving someone is. Essentially, it describes ability, specifically. SAR, on the other hand, describes value.
I’ll be busting out single-game SAR to rank the best single-game defensive performances in my next post; for now, let’s look at Average Saves Above Replacement (ASAR):
#Witnesses
Overall
I don’t really have the statistical know-how to run regressions and build a comprehensive formula that would spit out one number measuring how well someone played. We’ll get there one day. When we do, can we please call it Rho Score?
Anyway, what I can do in the meantime is factor in several of these metrics at once by scatter plotting them in Tableau. Yes, I understand that they would look different if I chose different axes.
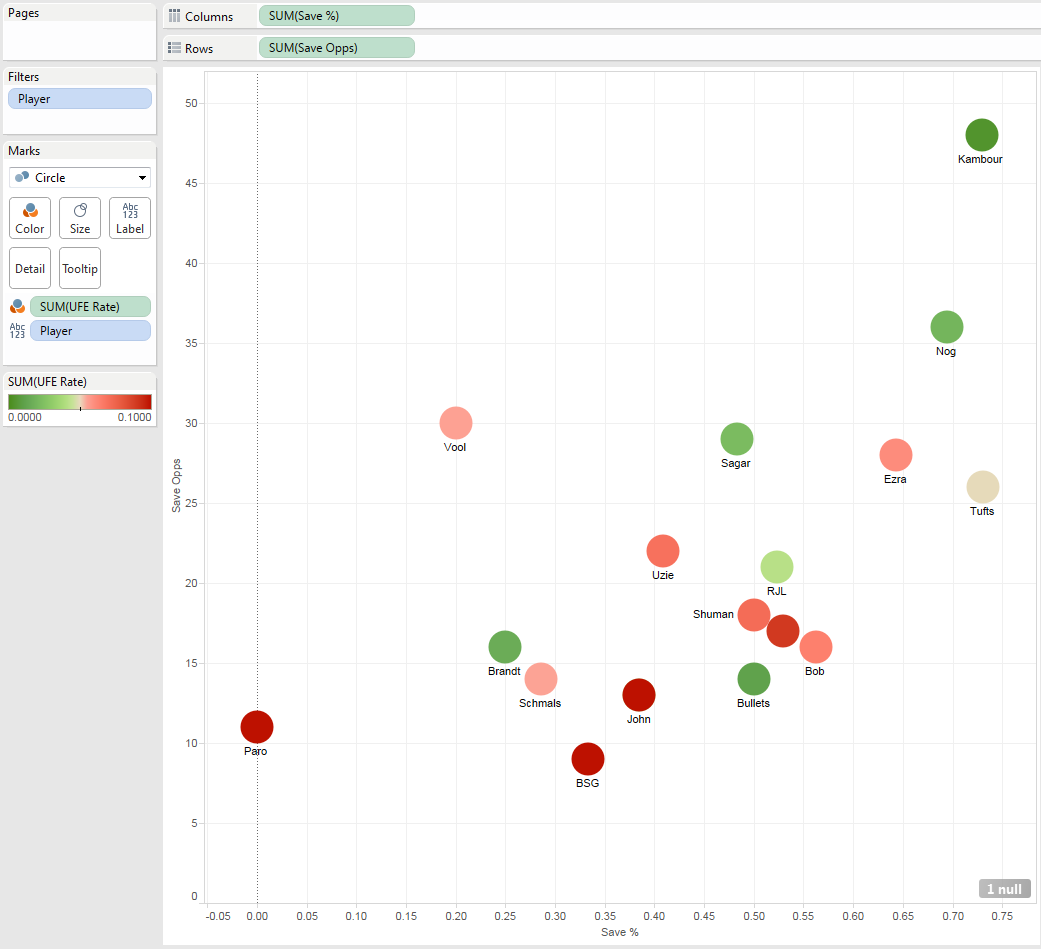
This first one looks at the game regardless of Events generated – basically, defense and UFEs:
This second combines a number of our fancy new statistics – ASAR, UFE Rate, Shooting Percentage, and Average Net Rating.
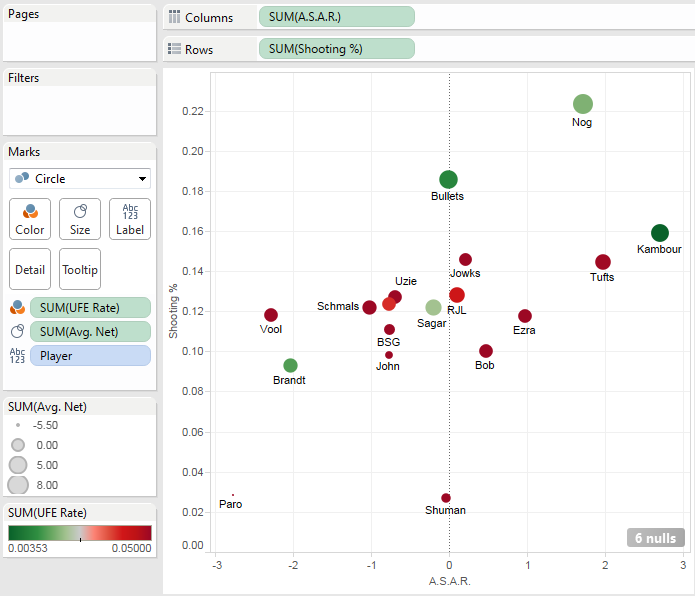
Well done, Nog. Nice tournament.